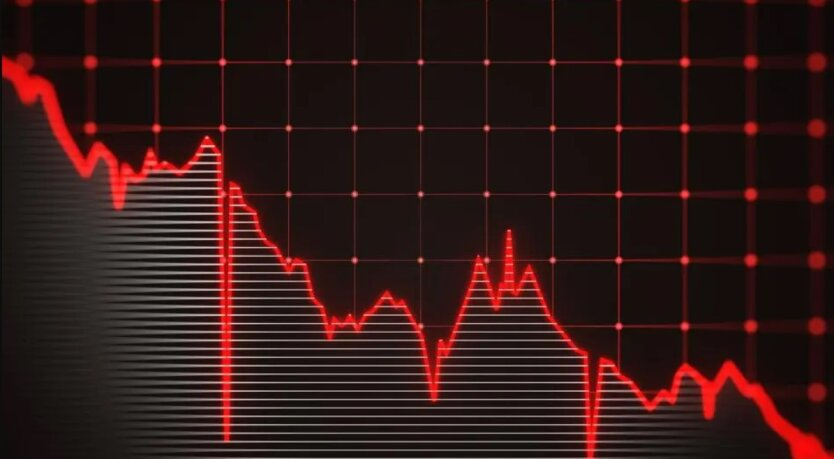
Stock market closure on the day of the crash: final SP and Nasdaq fall numbers.


The US stock market experienced the worst decline since June 2022
On August 5, 2024, the US stock market suffered the worst three-day decline since June 2022.
According to Bloomberg, the S&P 500 index and the tech-heavy Nasdaq 100 dropped 3%, while the Russell 2000 fell 3.3%.
The primary drivers of the decline were losses in the major tech sector. Nvidia shares dropped 6.4%, Apple fell 4.8%, and Microsoft fell 3.3%. These three companies accounted for about 50 points of the 160-point fall in the S&P 500.
The "Magnificent Seven" index, which includes the seven largest tech companies, fell 4.3%.
The trading volume was one of the highest this year - around 4 billion shares of S&P 500 components changed hands.
The Chicago Board Options Exchange Volatility Index (VIX) rose, reaching a level of 38 after a brief spike above 60 in the morning. In the bond market, there was a short-lived inversion gap between the yields of two-year and ten-year bonds.
At the end of the day, the yield on two-year bonds was 3.89%, and ten-year bonds were at 3.78%. Despite the significant decline, JPMorgan's trading team believes the outflow from the tech sector is "almost over" and the market is close to a tactical buying opportunity on the dip.
Previously, it was reported that the Dow Jones and S&P 500 indexes showed the largest decline since 2022.
Read also
- NATO prepares for Russia's invasion after the war in Ukraine: the whole problem is Trump
- Front line as of July 1, 2025. Summary of the General Staff
- Zelensky and the General Staff confirmed the death of Colonel Zakharevich
- Foreign Affairs: Ukraine can achieve a 'Korean scenario' in the war with Russia
- Storming the Enemy: Russians Forced to Attack Sumy Region 'On Their Own Two Feet'
- Unstable Frontline: How Battles Are Ongoing in the Zaporizhia Direction


