What is MACD and how to use the MACD indicator.


To earn from investments or trading, many tools are needed. Among them are indicators for analysis. Therefore, anyone who wants to earn in the financial sphere needs to understand, in simple terms, what MACD is in trading and how to work with the MACD indicator.
In addition, anyone new should understand how to use the MACD indicator to know how to work with such tools in the future. It is better to quickly learn how to use it and then build a profitable strategy.
What is the MACD indicator and why is it needed?

This tool helps assess market trends, determine entry or exit points from trades, and predict possible price direction changes. Understanding how the MACD indicator works becomes the foundation for further strategy formation aimed at achieving stable profits.
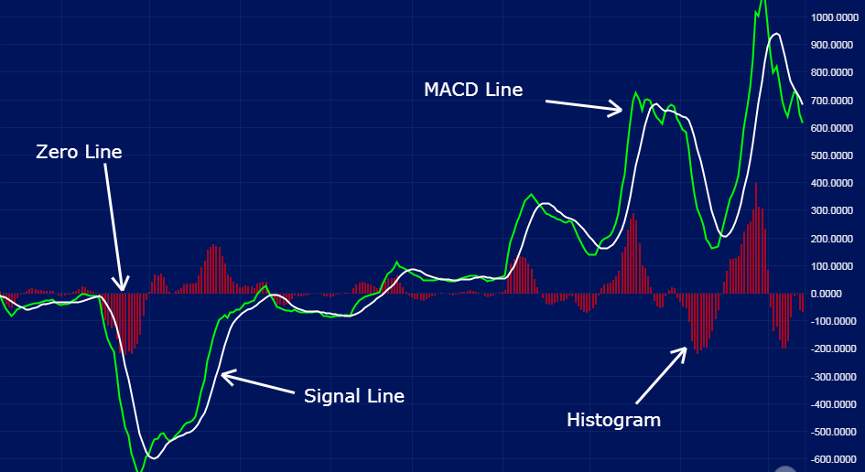
The MACD indicator was developed back in the 1970s and has become one of the most popular tools for technical analysis. Its main goal is to compare two exponential moving averages (EMA) with different periods: the fast one (usually period 12) and the slow one (period 26). Based on this comparison, traders obtain useful data about the current market state and can predict price movements.

This tool is convenient for analyzing any financial markets: stocks, cryptocurrencies, currency pairs, or commodity assets. Due to its versatility and simplicity, MACD is widely used by both professionals and beginners.
How to set up and work with MACD?
The MACD indicator stands out among other technical tools for its clarity and intuitiveness. To start using it, you need to understand the main setup steps:
-
Choosing a timeframe. Determine the Time interval suitable for your trading style (for example, a daily chart for long-term strategies or hourly for short-term).
-
Setting parameters. Standard EMA settings of 12, 26, and 9 are usually used. These values are suitable for most market conditions, but they can be adapted if desired.
-
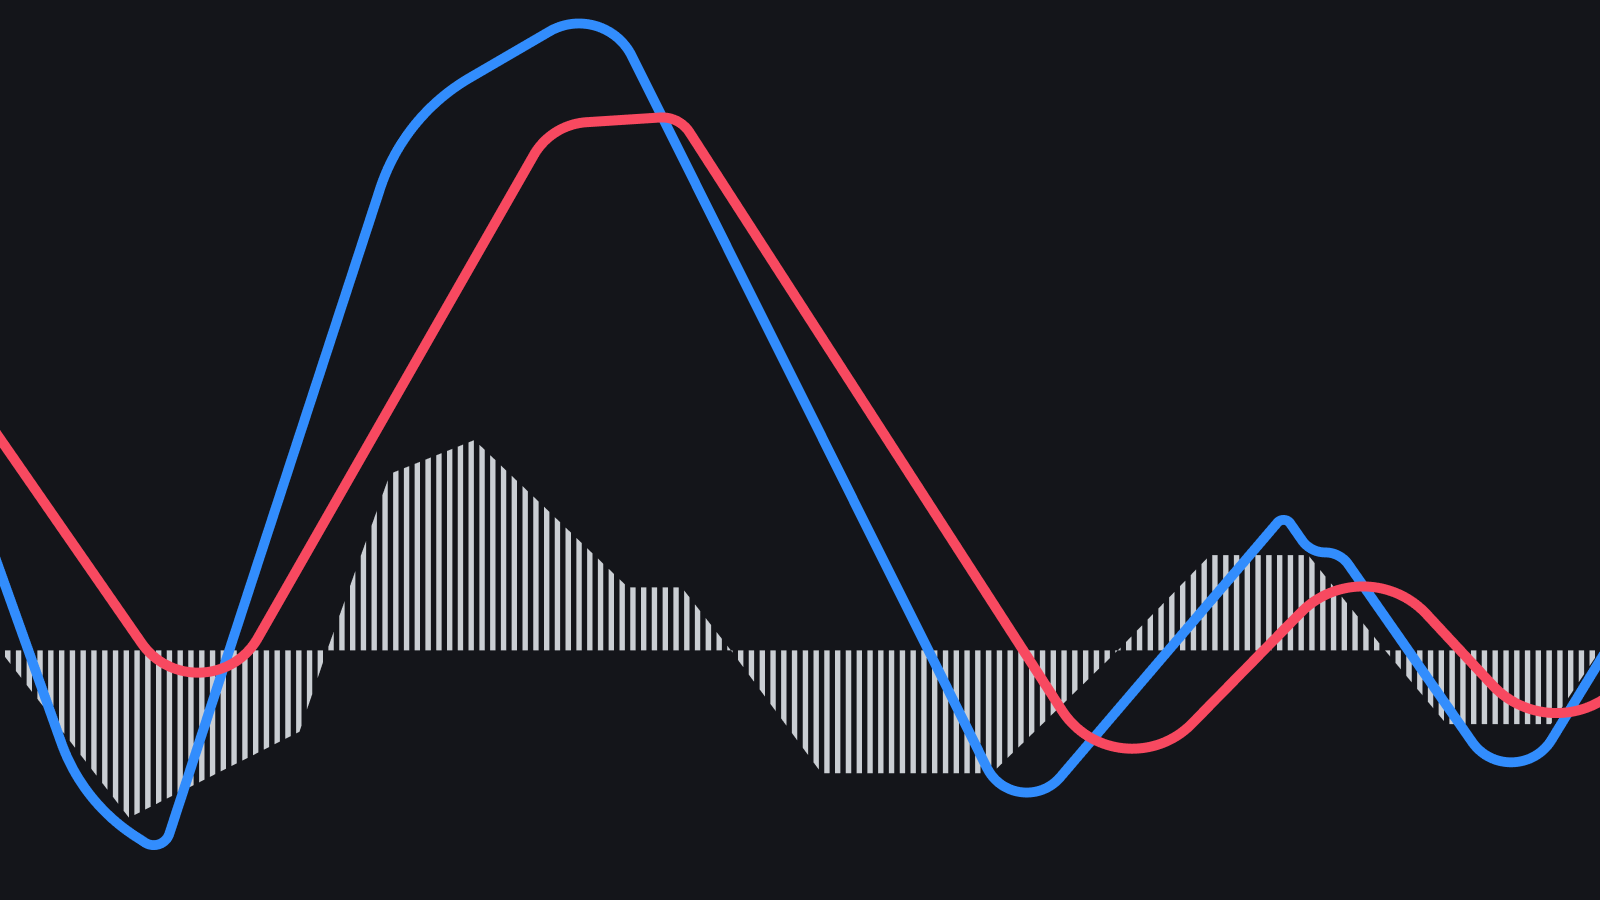
Analyzing the histogram. If the histogram is growing, it indicates an strengthening trend. When it decreases, the trend weakens, which may signal a reversal.
-
Evaluating intersections. The intersection of the MACD line with the signal line from below indicates a buy opportunity, and from above indicates a sell opportunity.

A few words should be said about why MACD attracts traders' attention:
-
Versatility. Suitable for analyzing stocks, cryptocurrencies, currency pairs, and other assets.
-
Simplicity. Even novice traders can easily understand how this tool works.
-
Effectiveness. Allows timely identification of reversal or continuation points of trends.
-
Visual clarity. The histogram and lines provide a clear understanding of the market state.
The MACD indicator is a powerful tool for forecasting and analysis that helps traders make informed decisions. Mastering its functionality can significantly improve the effectiveness of trading operations.
Where and how is the indicator used?

Typically, this indicator can be useful in trading. This is where it is chosen more often than in other areas. Here is how this can be done:
-
First, you need to determine the trend. MACD helps traders identify the current trend in the market. For example, if the MACD and signal line are above zero, it indicates an upward trend, which is useful for opening long positions.
-
Next, you need to look for entry and exit points. MACD is often used to identify signals for entering the market: the crossing of the MACD and signal line usually gives a clear signal for buying or selling.
-
There is also the concept of divergence. This concept between the asset price and MACD is one of the most powerful signals. If the price updates highs while MACD shows a decline, it may indicate an imminent downward reversal.
However, like any other system, this indicator has its limitations. These are also referred to as weaknesses. What should be noted:
-
The system has significant delays. Since the indicator is based on moving averages, its signals may arrive with a delay.
-
Additionally, the system often gives false signals. In low-volatility markets, MACD can issue many false signals.
-
The system does not show levels. MACD does not display support and resistance levels, so it is better to use it in conjunction with other indicators, such as RSI or Fibonacci levels.
All these disadvantages should be considered if there is a desire to use such a system in your work.
What expectations can there be for such an indicator in 2024?

As for the trends of the outgoing year, the indicator has not lost its relevance. And this is quite significant. Speaking of what to do with the indicator this year, one should note:
-
It is essential to combine the indicator with other tools. To increase accuracy, use MACD alongside volume indicators, candlestick patterns, or trend lines.
-
Don't forget about the news (it's better to keep track of them). In 2024, the markets in Ukraine and the world are subject to strong news movements. Monitor economic events that can affect your asset.
-
It is also important to continuously adjust parameters. If the standard settings do not work, choose EMA periods that better reflect the dynamics of your asset.
Despite all the fluctuations and instability in the markets, the MACD indicator remains a powerful tool. Through it, analysis is simpler. Moreover, at the same time, it is necessary to keep an eye on trends that affect strategies (strategies should be the baseline when choosing a set of tools). However, for successful trading, it is crucial to understand the limitations of the indicator and use it in combination with other tools. In the context of the Ukrainian market in 2024, especially for trading cryptocurrencies and stocks, MACD remains a relevant and reliable assistant. Overall, the indicator remains a robust tool that will definitely be useful for both beginners and experienced investors.
Read also
- What is MoneyGram in simple words
- What is needed for transferring and receiving money via Western Union
- What is Western Union in simple words
- Who is an acquirer in simple terms
- Who is an issuer in simple terms
- Is it possible to send money by mail abroad


